A pooled fund comprised of resources designated for investment by donors or the Board of Trustees, there are a variety of budgets and strategies at the College yoked to the market performance of the endowment. After peaking at just over $1.7 billion in June 2008 (resulting in an endowment-per-student ratio of over $1 million), the endowment shed almost a quarter of its value in the ensuing financial crisis. It has bounced back over the past couple of years, with a 19.2 percent investment return last year leaving the College with $1.641 billion in its back pocket. And barring unexpected financial turbulence, the College has the potential to reach a new all-time high for the size of its endowment come June.
The Biggest Difference-Maker
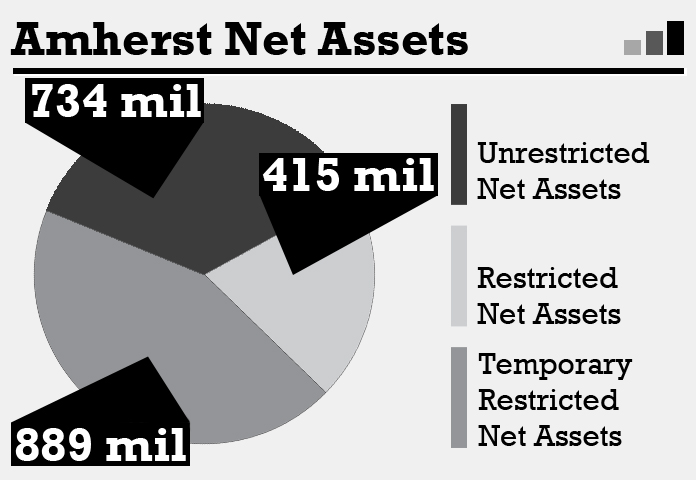
The endowment falls under the umbrella of Amherst’s net assets, which are divided into three categories: about $734 million of unrestricted net assets, which can be freely used for any purpose deemed suitable by the College; about $415 million of restricted net assets that are a permanent fixture in the endowment fund; and about $889 million of temporarily restricted net assets, which come with stipulations from donors. The endowment draws upon hundreds of millions of dollars from each of these funds.
Some of the strings that come attached to those funds stretch to not only designate the intended purpose of the money, but also how it is to be maintained. In other words, some funds come earmarked for donor-specified purposes, along with a condition that they remain invested as part of the endowment. Others must be kept in the endowment pool, but the College is free to spend the return income as it sees fit. Together, these income restricted and income unrestricted funds, respectively, combine to form one part of the endowment fund. The lion’s share of this $1.143 billion segment of the endowment comes from the income restricted funds, with the temporarily restricted net assets alone accounting for about half of the $1.143 billion total.
The remaining half-billion dollars in the endowment fund come from quasi-endowments, composed almost entirely of unrestricted net assets.
“Quasi-endowments are all the funds that for sound financial reasons the Board has chosen to invest rather than spend in any given year,” explained Treasurer Peter Shea. “Most of the Quasi-endowments come from gifts. An example would be a large gift amount that was received and could be spent on scholarships in a given year, but the Board chose to put it in a quasi-endowment fund and use the income for scholarships rather than spending the gift amount directly for scholarships.”
Liberal Arts Management
While some institutions like Harvard Univ. create internal management companies to attend to their endowments, Amherst employs a Chief Investment Officer and some staff, but only to facilitate the Board’s choices for the endowment strategy. The Board in turn acts through the Investment Committee, which is composed of six current and former trustees and chaired by William E. Ford ’83.
“We allocate to outside investment firms the actual investing,” said Shea. “So the investment office works with the Investment Committee as they select and manage the people who manage our money.” The Investment Committee, then, has control over the assets allocation and the different investment strategies used for the endowment — control over how much to invest in a particular investment manager, whom to invest with and thereby where and in what to invest.
Under the guise of maximizing return while limiting exposure to risk and volatility, Amherst’s investment portfolio is also diversified across fund managers, investment vehicles and investment horizons. The need for such diversity came into focus in 2008, as the performance of endowments across the country drooped alongside that of the economy.
The ABC’s of Endowment Spending
In the throes of the financial crisis, as market funds shriveled up and Amherst maintained a need-blind financial aid policy for students, the College leaned more heavily on its endowment than it ever has in recent history. According to last year’s Annual Report (copies of which are available online or at College Hall), since 1990, the College’s income from students (tuition, room and board) and operating expenditures have more than tripled to about $91 million and $173 million, respectively But because of the College’s steadfast commitment to a need-blind financial aid policy, student aid ($39 million last year) now comes off the top of the student income revenue. So starting with last year’s annual report, the College began reporting only net student income and net operating expenditures.
As student aid has more than quintupled since 1990, the share of student income in the net operating budget has dipped, dropping to about 39 percent last year as compared to 54 percent in 1996. Outside of the endowment, the other main sources of income for the operating budget are the Annual Fund and bequests received by the College — both of which have also showed significant growth since 1990. Bequests, however, are often added to the endowment pool for investment. And while the Annual Fund came in at over $10 million last year, the increase in financial aid from 2010 to 2011 alone cost the College about $4 million.
In the meantime, the size of the endowment funds invested in the market by the College have more than sextupled since 1990. In the fiscal year that ended last June — the second of three in which the Advisory Budgetary Committee (ABC) plans were implemented — the endowment comprised about 44 percent of the net operating budget, which was similar to the 46 percent exhibited in the first year of the ABC plan. In the heat of the financial crisis in 2009, the endowment comprised 46 percent of the net operating budget.
But a large endowment didn’t always mean a bigger share of the College’s net budget. At its peak size in 2008, the endowment accounted for 40 percent of the net operating budget. In 1990, the share was 36 percent; in 1999, it was closer to 30 percent. And in 1985, it was only 27 percent. Thus the central question is not where Amherst’s endowment stands, but how it works for you.
Given the growth in the size of the endowment, the comprehensive fee and the net operating budget, the next article in this series will take a closer look at the effects of endowment size and spending on an Amherst education.

Question : private equity and other non marketable investments are a large part of the portfolio and played no small part in the liquidity squeeze of late. How are these non marketable investments valued for reporting purposes ? who does it ? Isn't there a lot of latitude in making these valuations ? As a regular donor to the college , I think I and other donors should have a better understanding of the valuation process. During the squeeze , some of these investments had to be sold off - how big a hit did the college take ?